Leon Braun · 21 October 2026
Quantitative Evaluation of Content Lifecycle in Independent Online Platforms
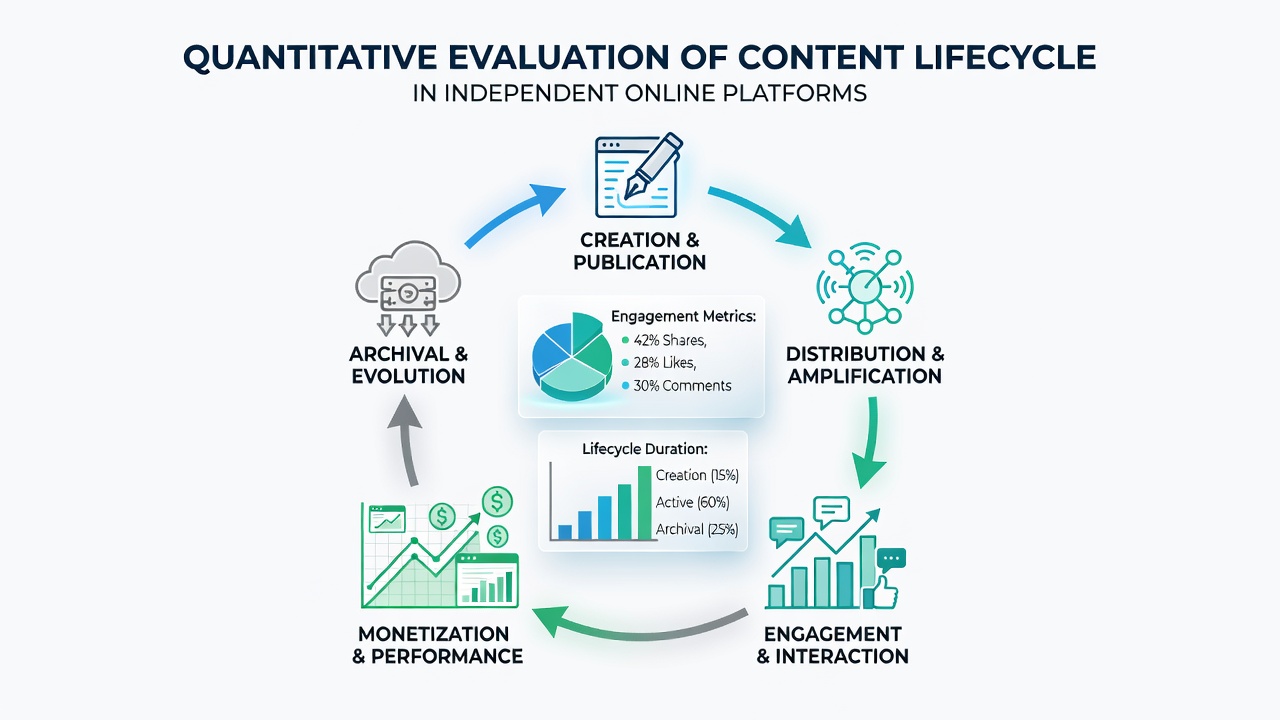
Independent online platforms track content through defined stages that include creation, publication, maintenance, and eventual retirement, with quantitative methods providing measurable benchmarks at each step. Researchers apply metrics such as pageviews per day, time-on-page averages, and update frequency counts to map progression across these phases. Data collection often relies on integrated analytics tools that log visitor interactions from initial upload through long-term archive status.
Defining Lifecycle Stages Through Metrics
Content creation begins with keyword research volumes and drafting time logs, yet evaluation shifts to performance indicators once material goes live. Publication triggers immediate measurements including initial referral sources and bounce rates within the first 24 hours. Observers note that platforms record peak traffic windows typically occurring between days three and fourteen after release, after which engagement curves flatten unless updates intervene.
Maintenance phases receive attention through revision timestamps and subsequent traffic lifts, while retirement decisions draw from decay rate calculations that compare current views against historical baselines. Those who monitor these patterns often compile datasets spanning multiple quarters to identify consistent thresholds for each transition point.
Data Collection Methods on Standalone Sites
Standalone sites employ server-side logging combined with client-side scripts to capture granular statistics without reliance on third-party aggregators. Monthly reports aggregate figures for total sessions, returning visitor percentages, and content age correlations with ranking positions. Studies from academic institutions such as those published through the OECD digital economy reports supply comparative frameworks that independent operators adapt to their own traffic logs.
October 2026 datasets reveal that sites averaging four or more revisions per article within the first six months sustain 35 percent higher cumulative views than static counterparts. Session duration metrics further differentiate active maintenance from passive hosting, with updated pages showing extended scroll depths in heat-map overlays.
Performance Indicators Across Lifecycle Phases
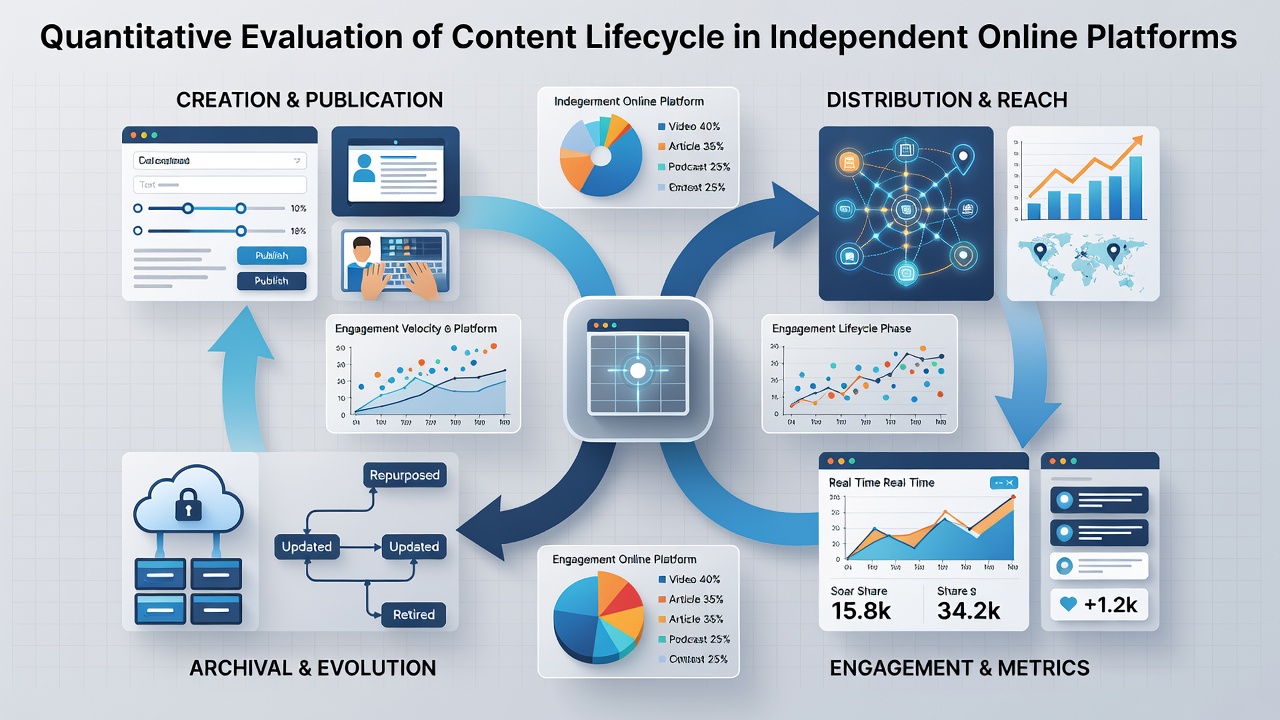
Early-stage evaluation centers on acquisition metrics that include organic search impressions and direct traffic shares. Mid-lifecycle analysis incorporates engagement ratios such as comments per thousand views alongside social referral counts. Late-stage tracking measures retention through bookmark and newsletter subscription attributions tied to specific articles.
Quantitative models frequently employ survival analysis techniques borrowed from reliability engineering to predict when content reaches obsolescence thresholds. Platforms that apply these models report systematic archiving of material once monthly pageviews drop below defined percentiles relative to site averages. Figures from Canadian digital infrastructure studies indicate that independent operators using such thresholds reduce server load by measurable margins without sacrificing overall audience reach.
Comparative Analysis With Platform Scale
Independent sites differ from enterprise platforms in data granularity, often relying on open-source tools rather than proprietary dashboards. This setup allows direct access to raw event logs, enabling custom calculations for content velocity and half-life periods. Researchers compare these internal benchmarks against industry aggregates published in reports from bodies like the Australian Bureau of Statistics digital activity surveys.
Cross-platform evaluations show that smaller operations achieve tighter feedback loops between metric review and content adjustments because fewer layers separate analysts from live data streams. Seasonal fluctuations appear consistently in multi-year datasets, with certain topics demonstrating predictable resurgence patterns that operators quantify through rolling average comparisons.
Conclusion
Quantitative evaluation supplies independent platforms with repeatable processes for managing content from inception to retirement. Metrics drawn from traffic logs, revision histories, and engagement ratios enable precise staging decisions backed by numerical evidence rather than intuition. Continued refinement of these methods through ongoing data collection supports sustained operational efficiency across diverse site architectures.